Analytics + Strategy
SOCIAL ANALYTICS
Overview
DATA DOESN'T EXPLAIN ITSELF
Numbers tell you what happened. Strategy tells you why — and what to do next. These two graphically designed social analytics reports, one for Texas Cannabis Collective and one for a Texas State University department, were built around that distinction.
What These Were
Each report moves beyond raw metrics to frame performance as strategic insight: why the top content worked, why underperforming content missed, and what the data actually means for the next decision.
01 — The Problem
METRICS WITHOUT MEANING ARE JUST NOISE
Most social analytics reports hand a client a spreadsheet or a platform export and call it analysis. Follower counts, reach numbers, and engagement rates without context don't tell a brand what to do differently. They just confirm that things happened.
The Gap
Both clients needed something more useful — a document that could be read by someone who doesn't live in the platform dashboard and still walk away knowing exactly where to focus.
02 — The Approach
DESIGNED TO BE READ, NOT FILED
Each report was built as a designed artifact, not a data export. Typography, hierarchy, and layout were treated as part of the communication — making the most important numbers land immediately and the supporting analysis easy to follow.
The Structure
Each report followed the same logic: here is what the data shows, here is what it means, here is why the best content performed, and here is why the worst content missed. That last part — the diagnosis of underperformance — is where most analytics reports stop short.
03 — Texas Cannabis Collective
READING AN AUDIENCE IN A RESTRICTED MARKET
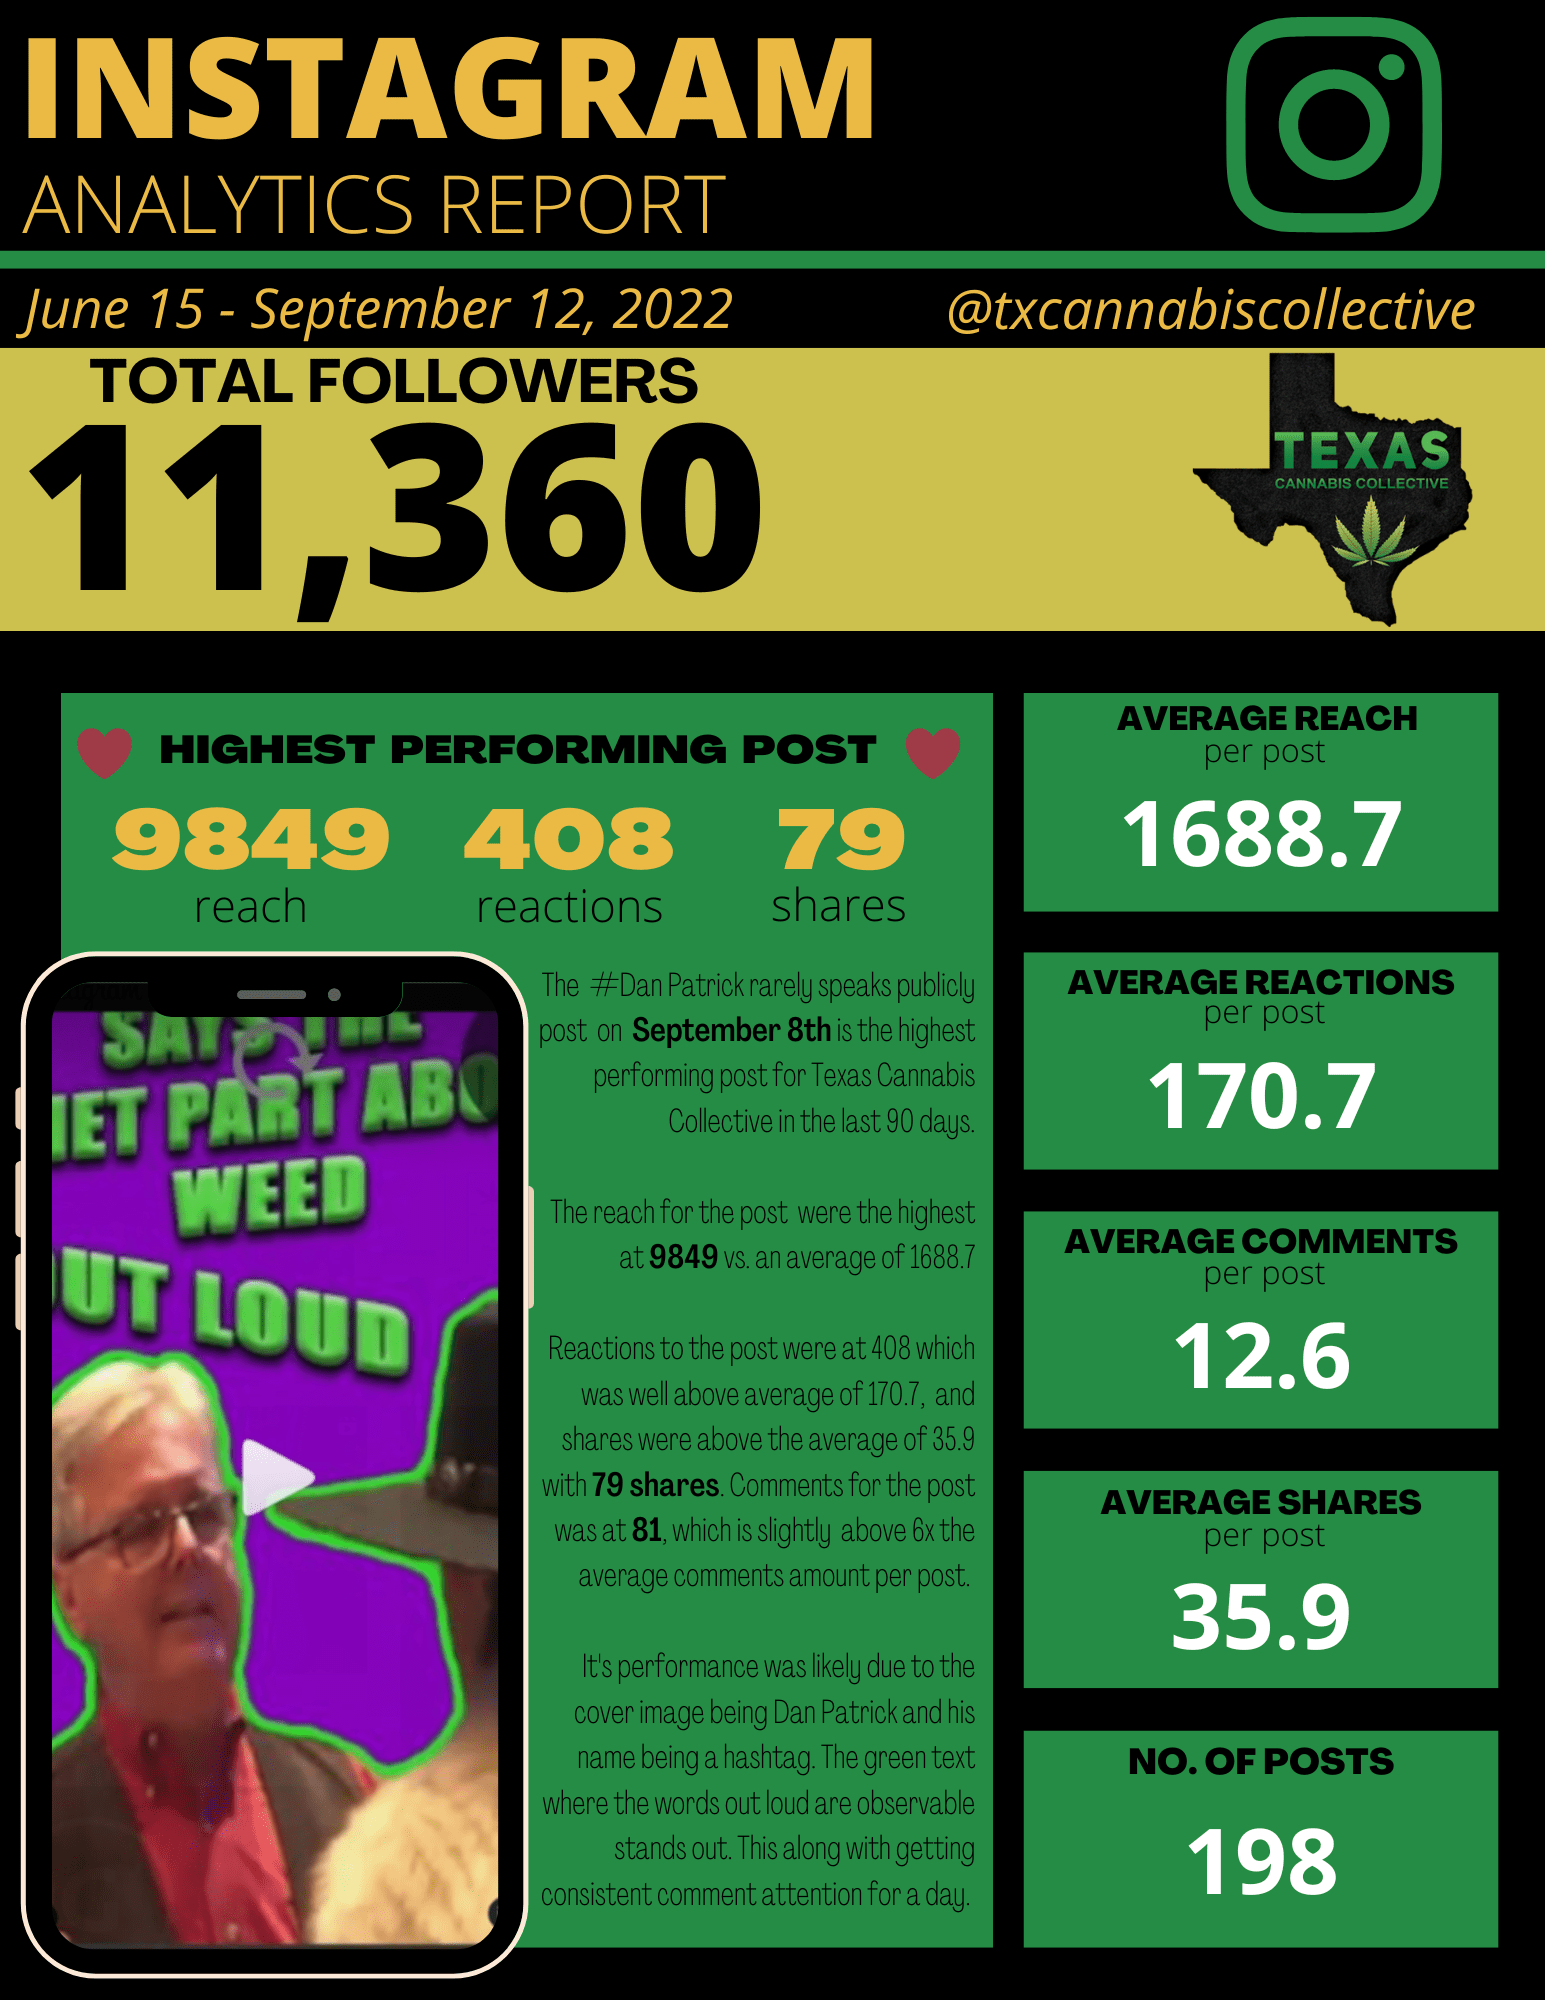
Over a 90-day period ending September 2022, @txcannabiscollective had grown to 11,360 Instagram followers across 198 posts, with an average reach of 1,688.7 per post and average reactions of 170.7.
The highest performing post of the period reached 9,849 accounts — nearly 6x the average — with 408 reactions and 79 shares.
The Diagnosis
The analysis identified three compounding factors: a recognizable public figure as the subject, a hashtag that extended reach beyond the existing audience, and a visual treatment with high-contrast text that stood out in feed without requiring sound.
That kind of diagnosis matters in a regulated market where paid amplification options are limited and organic performance has to work harder.
04 — Texas State University
THREE MONTHS OF STRATEGIC LISTENING
The university department report covered a full academic semester — tracking performance monthly, identifying content patterns, and delivering a comprehensive end-of-semester writeup that addressed both what worked and what the data suggested for the following term.
The Deliverable
The report was produced as part of an internship course with the Texas State University Pace Center and was delivered to the client as a functioning strategic document.
05 — Why It Matters
ANALYTICS AS STRATEGY, NOT REPORTING
The skill demonstrated here isn't data collection. It's the ability to look at what an audience did and explain the decision-making behind it — what they responded to, what they ignored, and what that means for the brand going forward.
The Transfer
That's the same muscle used in audience research, creative briefs, and brand strategy. The platform is different. The thinking is the same.